RESEARCH
·
·
The Worst Month of the Year
September has been the S&P 500's worst month since 1950, averaging a 0.6% decline while the other 11 months averaged a 0.88% gain.

Jacob Radke
1 min read
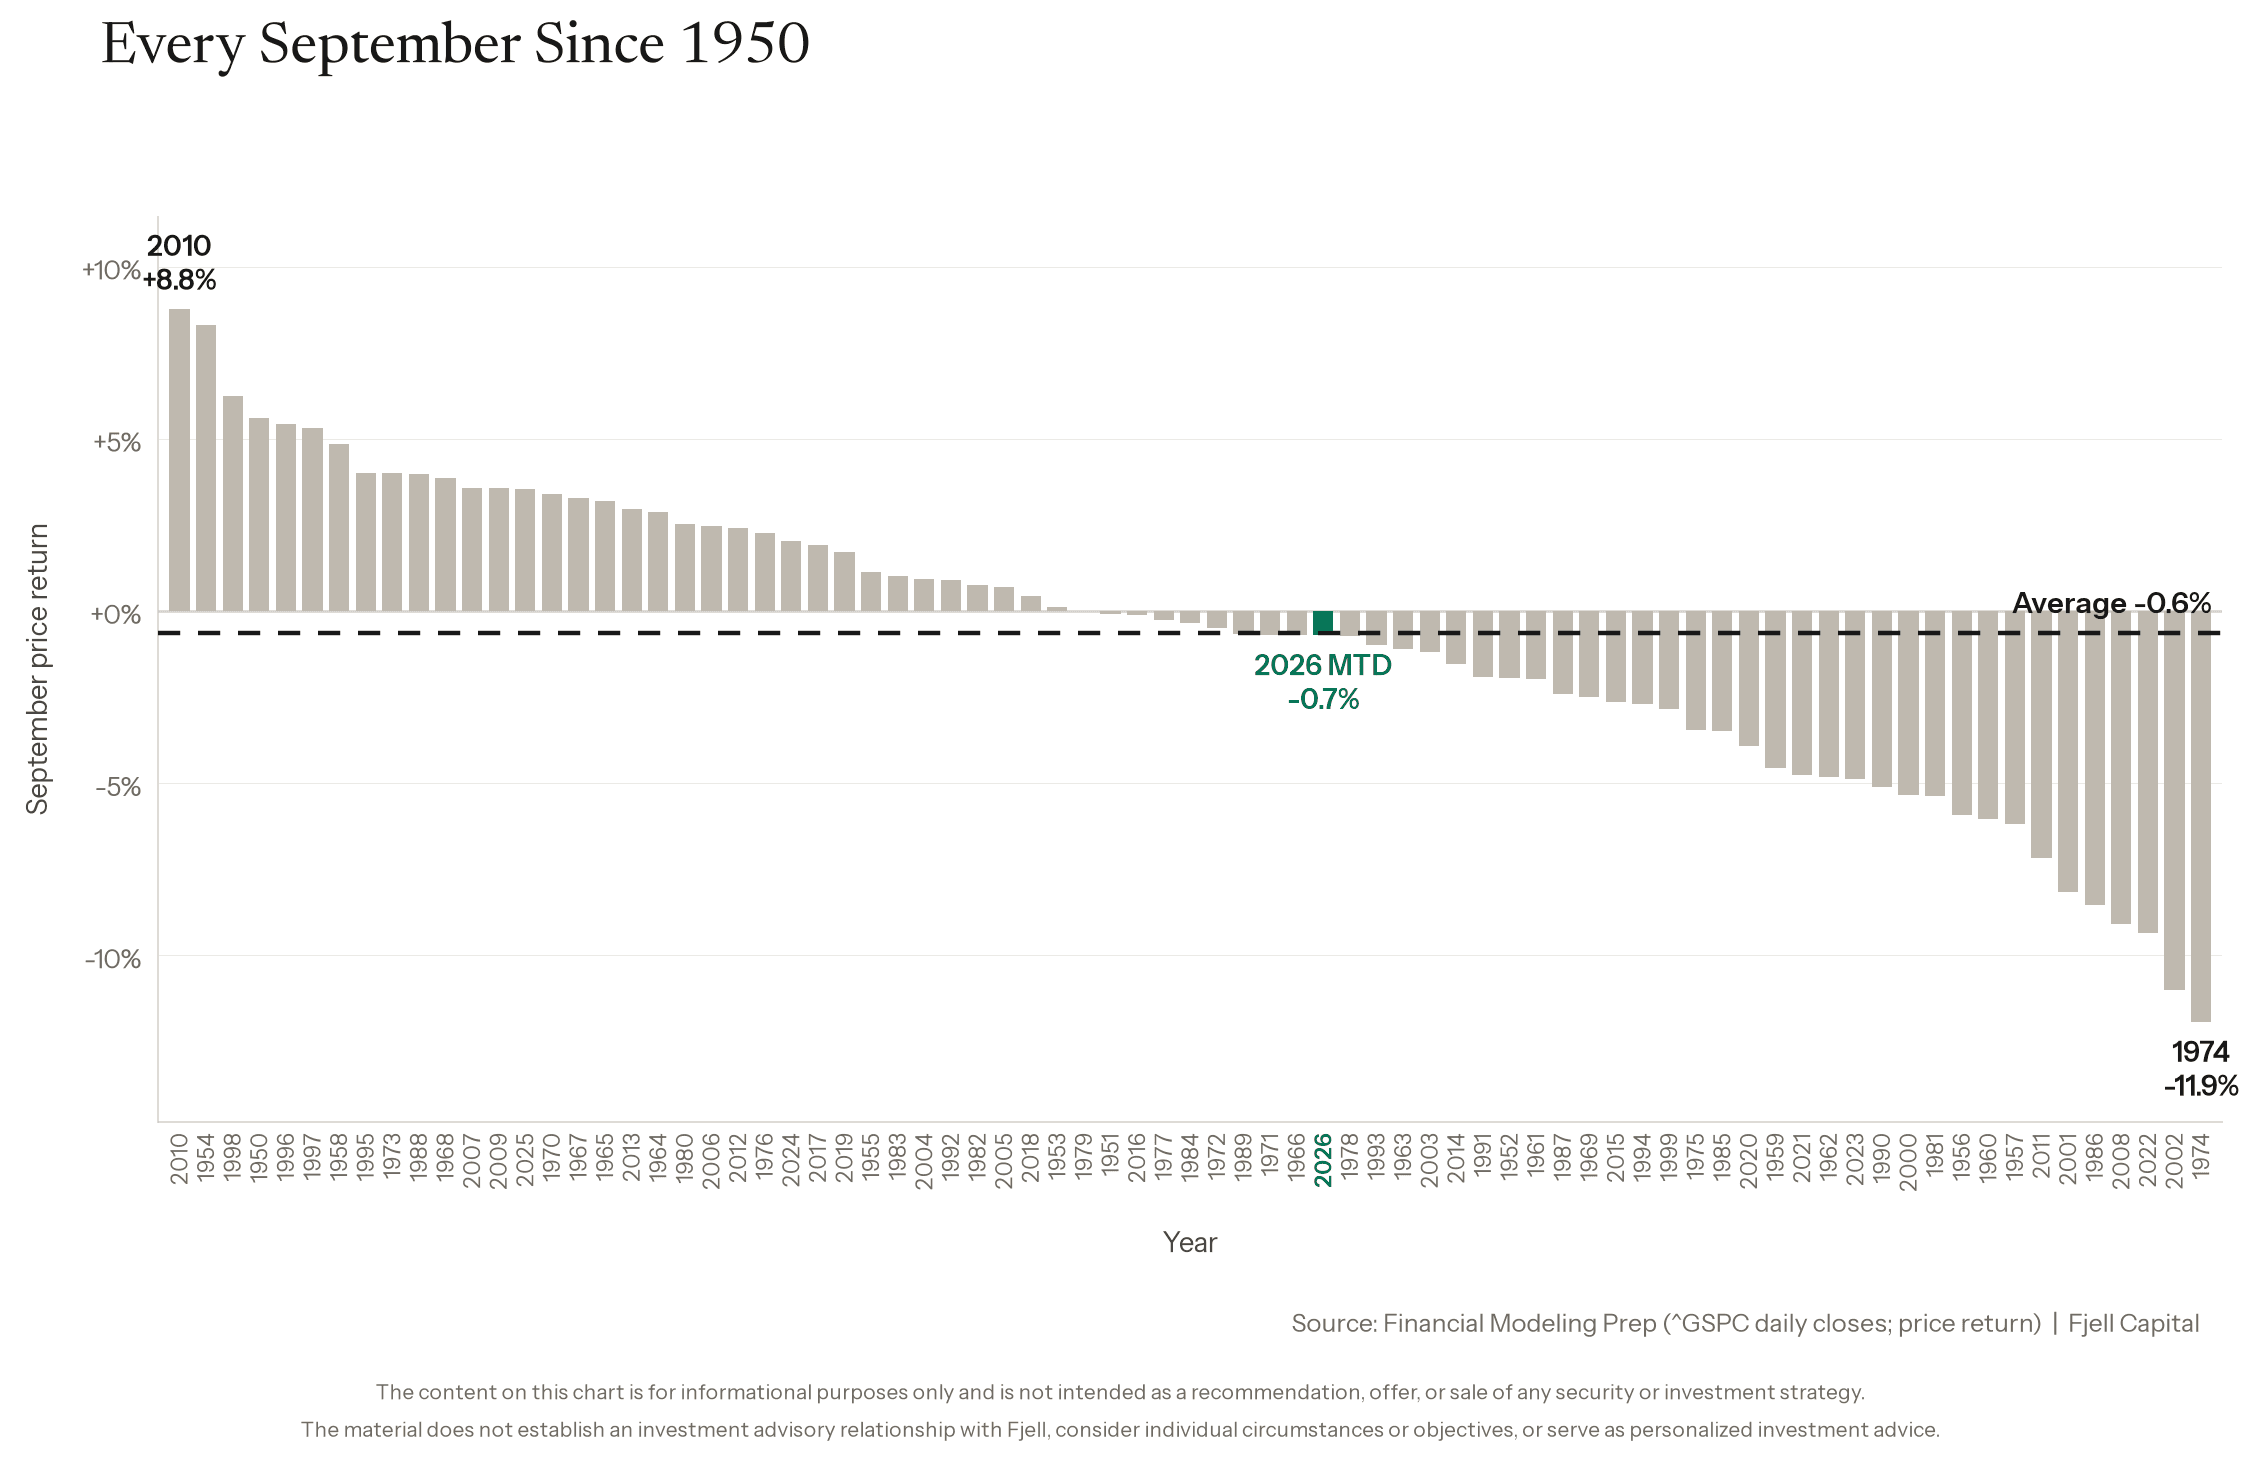
S&P 500 September price returns, 1950–2025, ranked; September 2026 month-to-date through September 17.
Source · Financial Modeling Prep; Fjell Capital analysis
Average September
−0.6%
Average S&P 500 price return in September from 1950 through 2025, the worst of any calendar month.
Average other month
+0.88%
Average S&P 500 price return across the other 11 calendar months over the same period.
September 2026 so far
−0.7%
S&P 500 price return for September 2026 through September 17.
Category
Markets & Investing
Charts
Share
Key takeaways
September averaged a 0.6% decline for the S&P 500 from 1950 through 2025, the worst of any month.
The other 11 months averaged a 0.88% gain.
There is no single accepted explanation; fund fiscal year-ends, quarter-end rebalancing and post-summer repositioning are possible factors.
September 2026 was down 0.7% through September 17, close to the long-run average.
Historically September has been the worst month of the year for the S&P 500.
From 1950 through 2025, it averaged a 0.6% decline. The other 11 months averaged a 0.88% gain.
There is no clear explanation for why. Possible reasons include mutual fund fiscal year-end activity, quarter-end rebalancing and investors returning from summer vacations and repositioning their portfolios.
So far, 2026 is down 0.7% through September 17, almost exactly in line with the long-run average.
Until next week,
Jacob
Sources & method
S&P 500 monthly price returns: Financial Modeling Prep daily ^GSPC closes, 1950 through September 17, 2026; Fjell Capital calculations. FMP API documentation.
Possible drivers of September weakness: Nasdaq Global Indexes, 2025.
Mutual fund fiscal year: Internal Revenue Service, Instructions for Form 8613.
Written by
Jacob Radke
Partner, Wealth Advisor
Jacob writes the weekly charts. Jacob leads the firm’s platform, including trading, research, portfolio systems and technology. He also sits on the firm’s board and investment committee, and advises client families.
Contact
KEEP READING
More from the archive
Oil Leads Energy Stocks Higher
Energy is the best performing sector in the S&P 500 this year, up 49% through Oct. 9 against 15% for the index. Oil explains most of it.
READ
What the 10-Year Yield Did After Rising on 18 of 24 Days
The 10-year Treasury yield rose on 18 of 24 trading days, closing at 5.29% on Sept. 30. In the 11 prior times since 1965, it was lower a year later in seven.
READ
Stocks One Year After the Fed Started Hiking
The S&P 500 was higher one year after six of seven completed Fed tightening cycles since 1983. The median gain was 4.4%.
READ
tmrw, delivered straight to your inbox.
One letter a week, and the charts on Tuesdays. No sales material, and no list sharing. Unsubscribe in one click.
Like what you are reading?
Let’s talk about it.
If something we published applies to your own situation, that is the right reason to call.
See if you are a fit
Educational content only. Nothing published here is personalized investment, legal or tax advice, a recommendation of any security, or an offer to buy or sell. Views are as of the date of publication and are not updated. Past performance does not guarantee future results.